5.4 Comparison of neural networks and tree-based models in the clinical prediction of the course of COVID-19 illness
Authors: Jakub Fołtyn, Kacper Grzymkowski, Konrad Komisarczyk
5.4.1 Abstract
The COVID-19 pandemic overwhelmed medical staff around the world, showing that effective and explainable models are needed to help allocate limited resources to those in need. Many published models for predicting COVID-19 related ICU admission and mortality were tree-based models or neural network models. We compared the two architectures in effectiveness, explainability and reproducibility. The two architectures appear to be similar with regards to their effectiveness, but the neural network model had significant reproducibility issues and worse explainability.
5.4.2 Introduction
In 2020 many papers presenting models aimed to predict the course of COVID-19 in patients emerged (Ma et al. 2020; Yan et al. 2020d; Zheng et al. 2020b). Article we are referring to (Li et al. 2020) differed from the majority with the use of neural networks.
In the past there were many attempts to compare effectiveness of artificial neural networks and tree-based models at various tasks using different types of data including tabular data (Ahmad et al. 2017; Arsad et al. 2013) and tasks connected to hospital patients outcomes (J. Wang et al. 2009). There were analyses showing superiority of forests over simple neural networks on small (up to 1000 records) tabular datasets (Klambauer et al. 2017). Data used by the referred article’s authors consisted of 1020 or 1106 observations depending on the researched problem.
Authors note the importance of explainability of clinical models (Tonekaboni et al. 2019) due to the need of establishing clinician’s trust to successfully deploy a model. There are tools for explaining tree-based models (Przemyslaw Biecek and Burzykowski 2021a; Chen and Guestrin 2016b) and some of methods are not available for neural networks. Tools to calculate SHAP values for forest models were developed (Scott M. Lundberg et al. 2019), while general algorithm to compute them exactly in a reasonable complexity for deep learning models, only approximations can be made. Explaining neural networks with SHAP values is an important issue in the field (R. Wang et al. 2021).
The referred article does not provide a source code for the replication of the results. Taking care about the reproducibility is considered a major problem in the academic society (WUoT 2020).
Motivated by the preceding we aim to contribute to the work started by the authors of the referred article. At first, we try to replicate models. Then we propose different network architectures and XGBoost models. Finally, we compare the effectiveness of all the models at the prediction tasks and their explanations based on the SHAP values.
5.4.3 Methods
Three neural network models and XGBoost model were trained for both ICU admission prediction and death prediction. The tested neural network architectures were:
replication of the architecture proposed by (Li et al. 2020) (referred to as the Baseline model),
modified version of that architecture using binary cross entropy as the loss function (Baseline (crossentropy) or Modified)),
basic neural network model using two hidden layers of 32 neurons each with binary cross entropy as the loss function (Basic).
Neural network models were created using Keras Python library (Abadi et al. et al. 2015). All models were trained and tested on data provided in the article (Li et al. 2020). Feature selection was performed as described in the article. Data was split in a 75:25 (train:test) ration. To reduce overfitting, an internal 0.2 validation set size was used.
Effectiveness of those models were compared using receiver operating characteristic area under curve (ROC AUC) metric (Hanley 2014). ROC AUC values were calculated using the test data held out from training. Neural network models were trained 25 times each to compare stability.
SHAP values were calculated for the xgboost models using the R treeshap library (Komisarczyk, Konrad and Maksymiuk, Szymon and Koźmiński, Paweł and Biecek, Przemysław 2020).
Approximate SHAP values were approximated for neural network models using DeepExplainer from the Python SHAP library.
Feature importance was calculated using mean SHAP values and compared.
5.4.4 Results
ROC curve comparison between all ICU admission models is shown in the figure 5.27. XGBoost model was the best-performing model, based on the ROC AUC score. The best-performing neural network model was the Basic model (the neural network model with only 2 layers), with a ROC AUC score of 0.696. In the mortality prediction task, however, the Basic neural network model outperformed all other models, as shown in figure 5.28. It is worth noting that in both cases the Baseline model, which was the replication of the (Li et al. 2020) model had the lowest ROC AUC scored, and therefore is indicated to have performed the worst.
![ROC curves comparison for ICU admission prediction models. The dashed line indicates a random classifier (a model that classifies values in a random way). Each row in the legend contains model's line color, name and ROC AUC score. Neural network model names explained: *Baseline* - a replication of the model from [@5-4-li-et-al] article, *Basic* - basic model using two hidden layers of 32 neurons each with binary cross entropy as the loss function, *Modified* - modified version of the article model using binary cross entropy as the loss function.](images/5-4-icu_comparison.png)
Figure 5.27: ROC curves comparison for ICU admission prediction models. The dashed line indicates a random classifier (a model that classifies values in a random way). Each row in the legend contains model’s line color, name and ROC AUC score. Neural network model names explained: Baseline - a replication of the model from (Li et al. 2020) article, Basic - basic model using two hidden layers of 32 neurons each with binary cross entropy as the loss function, Modified - modified version of the article model using binary cross entropy as the loss function.
![ROC curves comparison for mortality prediction models. The dashed line indicates a random classifier (a model that classifies values in a random way). Each row in the legend contains model's line color, model's and ROC AUC score. Neural network model names explained: *Baseline* - a replication of the model from [@5-4-li-et-al] article, *Basic* - basic model using two hidden layers of 32 neurons each with binary cross entropy as the loss function, *Modified* - modified version of the article model using binary cross entropy as the loss function.](images/5-4-mortality_comparison.png)
Figure 5.28: ROC curves comparison for mortality prediction models. The dashed line indicates a random classifier (a model that classifies values in a random way). Each row in the legend contains model’s line color, model’s and ROC AUC score. Neural network model names explained: Baseline - a replication of the model from (Li et al. 2020) article, Basic - basic model using two hidden layers of 32 neurons each with binary cross entropy as the loss function, Modified - modified version of the article model using binary cross entropy as the loss function.
To ensure the reliability of neural network models, each model was trained and tested 25 times. The resulting boxplots can be seen in the figure 5.29 for the ICU admission prediction data and in the figure 5.30 for the mortality data. The comparison score for both cases was ROC AUC score. As we can see in figure 5.29, the Baseline model trained on ICU admission data has proven to be especially unreliable, with AUC score ranging from 0.35 up to 0.7, while other 2 models outperformed it, with both better scores and lower variances. Figure 5.30 shows that models trained and tested on the mortality data had overall better ROC AUC scores than their ICU admission counterparts, but some outliers can be noticed for both Baseline and Modified, reaching as low as 0.5 ROC AUC score.
![each boxplot represents 25 independent model tests. Neural network model names explained: *Baseline* - a replication of the model from [@5-4-li-et-al] article, *Basic* - basic model using two hidden layers of 32 neurons each with binary cross entropy as the loss function, *Modified* - modified version of the article model using binary cross entropy as the loss function.](images/5-4-icu_nn.png)
Figure 5.29: each boxplot represents 25 independent model tests. Neural network model names explained: Baseline - a replication of the model from (Li et al. 2020) article, Basic - basic model using two hidden layers of 32 neurons each with binary cross entropy as the loss function, Modified - modified version of the article model using binary cross entropy as the loss function.
![each boxplot represents 25 independent model tests. Neural network model names explained: *Baseline* - a replication of the model from [@5-4-li-et-al] article, *Basic* - basic model using two hidden layers of 32 neurons each with binary cross entropy as the loss function, *Modified* - modified version of the article model using binary cross entropy as the loss function.](images/5-4-mortality_nn.png)
Figure 5.30: each boxplot represents 25 independent model tests. Neural network model names explained: Baseline - a replication of the model from (Li et al. 2020) article, Basic - basic model using two hidden layers of 32 neurons each with binary cross entropy as the loss function, Modified - modified version of the article model using binary cross entropy as the loss function.
Feature importance comparison for ICU admission task is shown in figure 5.31. In all of these models Procalcitionin was the most important feature (it is worth reminding, that our models were trained only on the top 5 features for ICU admission task, and top 6 features for mortality prediction task), while other features’ significance differ between models. What is more, Procalcitionin was much more impactful for the neural network model, with mean SHAP value nearly doubling the value of the 2nd most import feature.
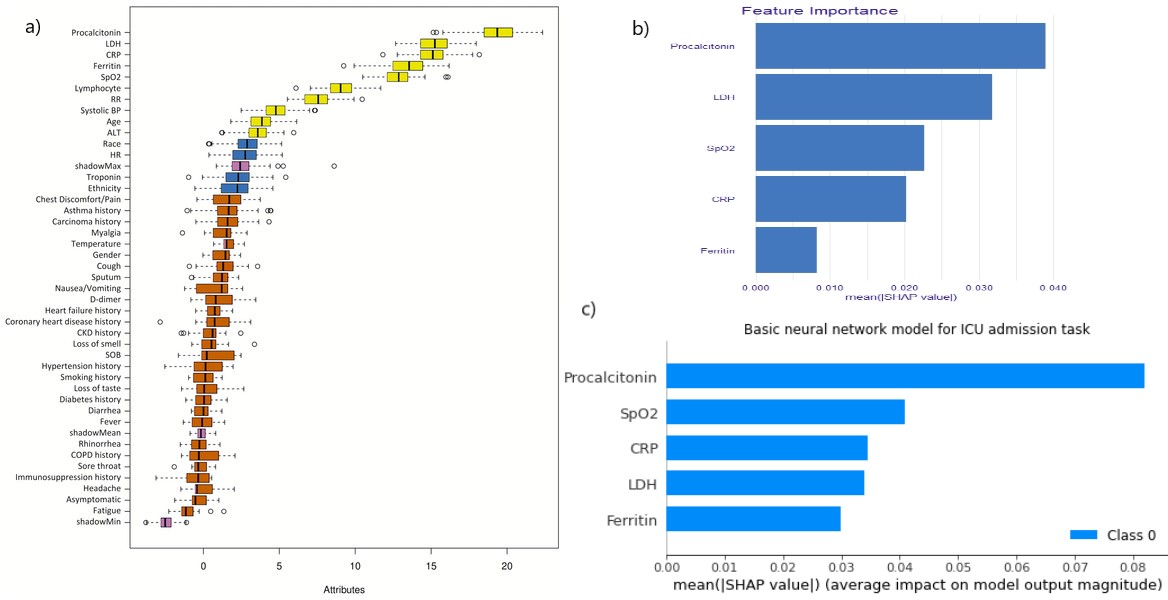
Figure 5.31: a) Boruta algorithm results from the article. Only the top 5 features are taken into consideration. b) feature importance barplot for xgboost model c) feature importance barplot for Basic neural network (model using two hidden layers of 32 neurons each with binary cross entropy as the loss function). The bars in b) and c) represent the mean SHAP values for each feature.
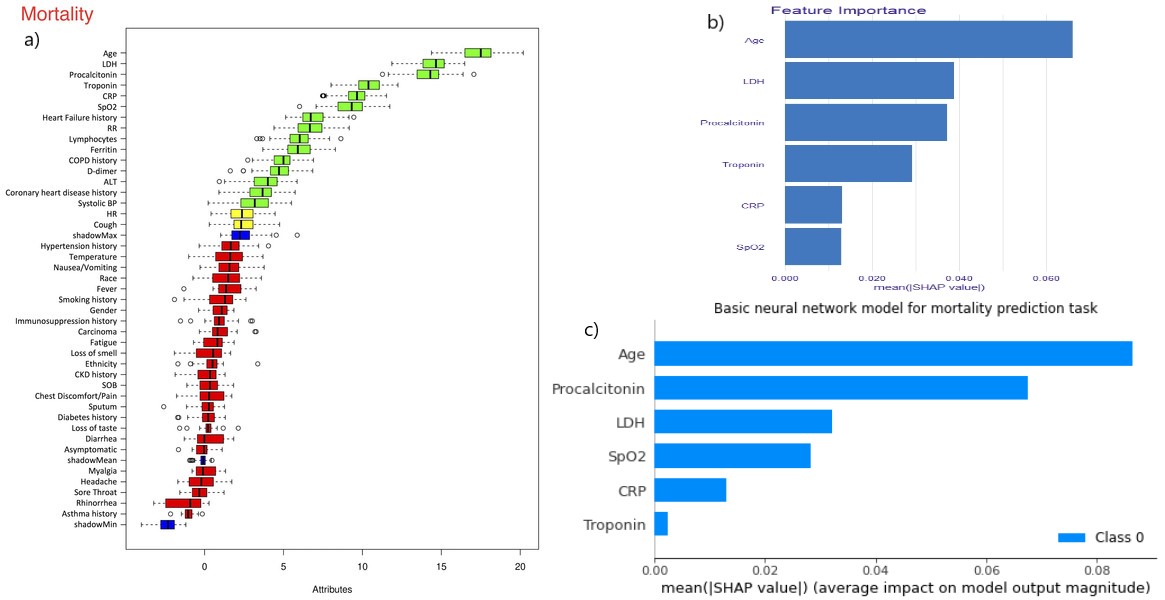
Figure 5.32: a) Boruta algorithm results from the article. Only the top 6 features are taken into consideration. b) feature importance barplot for xgboost model c) feature importance barplot for Basic neural network (model using two hidden layers of 32 neurons each with binary cross entropy as the loss function). The bars in b) and c) represent the mean SHAP values for each feature.
5.4.5 Discussion
The COVID-19 pandemic has demonstrated a need for quick development, testing, validation and deployment of machine learning models. However, this can’t come at the expense of reproducibility, as the replication crisis still poses a serious issue. Parts of the description provided in the reference article can be imprecise enough to be misunderstood or have more than one meaning. In the field of machine learning both data and source code are necessary components to reproduce results. This is even more important when proposing unusual model architectures, as those can lead to new discoveries in the field. However, when proposing such an architecture, a baseline model should be used to demonstrate that the proposed architecture can preform better. Finally, different external validation techniques should be used, such as a leave-one-hospital-out cross-validation or working on combined data from multiple sources. While our team focused primarily on comparing model architectures, other chapters in the WB Book examine those aspects of fair artificial intelligence. In conclusion, we have shown the importance of providing reproducible code, as well as having a baseline model to compare the results.
5.4.6 Source code
Source code for all models and figures mentioned in the article, including used data is available at the Github repository https://github.com/konrad-komisarczyk/wb2021 in the proj2 subdirectory.