1.1 How to measure reproducibility? Classification of problems with reproducing scientific papers
Authors: Paweł Koźmiński, Anna Urbala, Wojciech Szczypek (Warsaw University of Technology)
1.1.1 Abstract
After quite short time the computational aspects of scientific papers become obsolete or inexecutable (e.g. codes are not valid with current environment, resources are inaccessible, some classes require additional parameters). The extent of such a loss of timeliness of a paper may vary a lot. We develop a scale suitable for comparing reproducibility of various papers. This scale is based on enumerating and subjective evaluation of the impact of irreproducibilities on the reception of the paper.
1.1.2 Introduction
The idea of reproducibility of scientific researches is crucial especially in the area of data science. It has become more important along with the development of methods and algorithms used in machine learning as they are more and more complex and complicated. This issue concerns users of all types: students, scientists, developers. Moreover, attaching code used in a paper, helps readers to focus on the real content rather than sophisticated explanations and descriptions included in the article. It is also valuable because the users can use the code as examples of using the package.
However problem of the reproducibility is much more complex, because there is no explicit way of measuring it. It means that most of its definitions divide articles into 2 groups - reproducible and irreproducible. Thus, finding an appropriate reproducibility metrics, which would have wider set of values would result in changing the way reproducability is perceived. As a result such a metric would provide much more information for a person who would be interested in reproducing an article.
1.1.2.1 Definition
Reproducibility as a problem has been addressed by scientists of various fields of studies. The exact definition also differs among areas of studies. For instance, Patrick Vandewall in 2009 suggested a definition of a reproducible research work: “A research work is called reproducible if all information relevant to the work, including, but not limited to, text, data and code, is made available, such that an independent researcher can reproduce the results” (Vandewalle, Kovacevic, and Vetterli 2009). On the other hand, Association for Computing Machinery (Computing Machinery 2018) divides the problem into three tasks as follows:
Repeatability (Same team, same experimental setup):
The measurement can be obtained with stated precision by the same team using the same measurement procedure, the same measuring system, under the same operating conditions, in the same location on multiple trials. For computational experiments, this means that a researcher can reliably repeat her own computation.Replicability (Different team, same experimental setup):
The measurement can be obtained with stated precision by a different team using the same measurement procedure, the same measuring system, under the same operating conditions, in the same or a different location on multiple trials. For computational experiments, this means that an independent group can obtain the same result using the author’s own artifacts.Reproducibility (Different team, different experimental setup):
The measurement can be obtained with stated precision by a different team, a different measuring system, in a different location on multiple trials. For computational experiments, this means that an independent group can obtain the same result using artifacts which they develop completely independently.
For the needs of this chapter we will use the Vandewalle’s definition and treat papers as fully reproducible only when they meet the conditions listed there.
1.1.4 Methodology
We considered plenty of papers from many issues of The R Journal - one of the most popular magazines concerning scientific researches, including new R packages. The journal stands out from the magazines because the researches usually upload supplementary material with their articles so it is very easy to check if the code can be reproduced in right way. The articles we checked during our research were published in various years - the newest comes from December 2019 while the oldest is from 2009. We have to admit that the majority of articles could be reproduced without any problems. For the needs of this article we mention only papers where any problems occured.
As we faced the problem of measuring reproducibility we discussed many ways of grading its level. One of the ideas was to create a unified measure of value that would calculate the ratio of functions that managed to execute. We quickly noticed that this approach is not appropriate as sometimes it is not fair to dock the mark by the same value in various examples. For instance we could meet a minor problem that interefered with executing an additional feature and, on the other hand, a vast problem that was a reason that we could not produce an important plot at all. Moreover, sometimes the success of executing the function, was not only defined by completing the work without errors but by the output’s quality. Sometimes the plots were produced without any number values what made them absolutely useless or without one minor annotation which still allowed to make similar conclusions as authors.
These were the reasons why we did not decide to create a simple numeric measure of reproducibility, which probably would be very convenient for data scientists, especially statisticians. When we were checking the articles in terms of reproducibility we noticed that the problems we are facing can be group into a few categories of similar ones. It was on impulse to propose six major categories that can be faced during try of reproducing the results presented in a scientific paper:
No access to external resources
Some parts of code require access to external resources, for example third-party API or data downloaded from web. If the data was removed from the website, we may have a problem (or it can be impossible!) reproducing the results.No compatibility with current versions of used packages
Some packages are deprecated or only available in the older version of R. It can cause problems and is unacceptable.Code vulnerable to user settings (especially graphic issues)
The output often depends on the environment settings. For example the scale of the graphics can make it illegible and useless. There were cases that the code attached to article produced completely different figure than the presented one.Additional configuration required
Some packages require a non-standard installation. To use some features it can be required to install system packages. Sometimes it is also required to take additional steps (configure access to API e.t.c.).Randomness problems
Some functionalities are based on randomness. Sometimes changing the seed may change the results and make it difficult to draw correct conslusions.No access to source codes
Some results shown in an article could not be reproduced because the codes had not been attached to or included in the article.
We developed a 6-point scale (0 - completely irreproducible, 5 - fully reproducible) evaluating in what degree these problems belong to each category. Points are assigned subjectively depending on our feeling of the severity of the problem. When a category did not appear in the article, it was signed as N/A - not applicable. To minimilize the affect of the personal feels, every article was checked independently by at least two persons.
1.1.4.1 Mark examples
Most of the articles were reproducible to some extent. None of them were fully irreproducible. However there were few examples, where inability of compiling the first chunks of code resulted in very low marks for the article and thus giving it up with no further research being carried through. Perfect example of such behaviour can be found in an article “MCMC for Generalized Linear Mixed Models with glmmBUGS”(Brown and Zhou 2010), where all of the following code chunks depended on first ones, which couldn’t be compiled. The reason was that the function, which was resposible for making crucial calculations couldn’t find a registry address. It ended up with displaying both the error and warning message. Second thing which led to lowering the mark was difficulty with code availibility. There were articles, for instance “RealVAMS: An R Package for Fitting a Multivariate Value-added Model (VAM)” (Broatch, Green, and Karl 2018), where there were no source codes for all of the figures, which were used in article. Moreover the figures were the main part of the article, thus we decided to lower the mark for access to the source code. Fortunately our team of scientists managed to reproduce the results, despite lack of source code. This article was also an example of having attached obsolete data. It resulted in poor similarity of graphs and plots between the figures we made ourselves and those, which were used in article. Majority of articles were given very satsfying marks, beacuse there were only a few things we could complain about. Fortunately they didin’t have such an impact on reproducibility itself, but rather were annoying for someone who wanted to achieve the same results. The perfect example of such an article is “tmvtnorm: A Package for the Truncated Multivariate Normal Distribution” (Wilhelm and Manjunath 2010). The code had to be manually copied from the article and then reformatted before pasting in into the R console. It’s not a major obstacle, but it may lead to some syntax mistakes and enlengthen the time needed to reproduce the results.
1.1.5 Results
During the research, our team of scientists examined 16 scientific articles published in The R Journal in terms of reproducibility. As stated before, we decided to divide a mark into six categories and check the level of correctness with the results described in the paper. Every category was graded in six-point scale provided always that a category might not apply in a paper. However, we did not measure the effectivity or functionality of the code as it was not in the scope of this research. To avoid the effect of subjectivity, all articles were graded by at least two of us. Later we calculated the average of the marks. When any category was marked as “not applicable” by at least one marker, it was not taken into consideration in the final summary.
The list of articles checked is here.
The summary of our marks is presented in the boxplot.
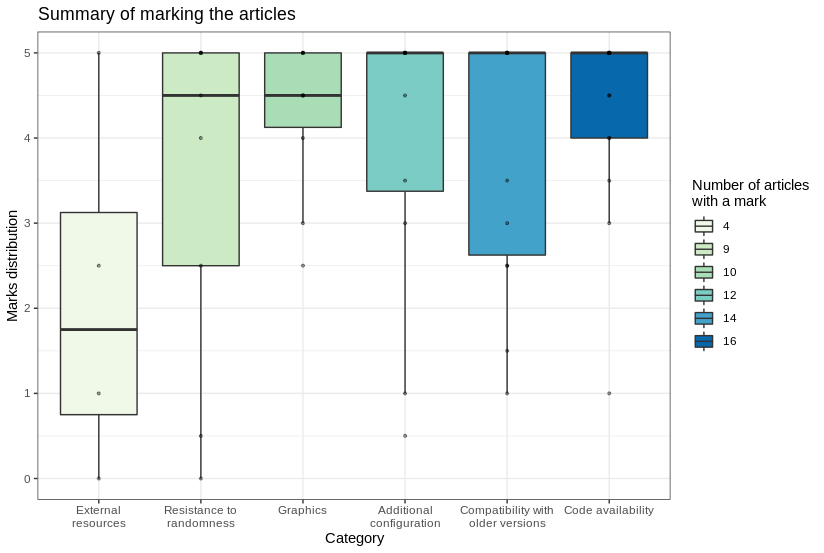
Articles’ marks distribution
As we can see in the plot, packages dependent on external resources are in a minority. Despite that, when we examined one, there was often a problem with dependencies. It could be caused by many reasons, e.g. external data sources or other packages. On the other hand, availability of the source code and graphical aspects of articles turned out to be the most reproducible categories. Resistance to randomness was one of the most interesting categories in our opinion and it turned out to be a category with high variation of grades. Many authors coped with the problem by setting random seeds but sometimes the differences were unavoidable.
1.1.6 Summary and conclusions
Having revised many different articles from different areas and years of publishing clearly we managed to take a wide snapshot of problems, which people can ecnounter while trying to reproduce the articles. There is no doubt that the categories we proposed are quite subjective and arbitrary, however we are convinced that most of the obstacles that could be faced during reproduction fall into one of these categories. Our scientific research team strongly beliefs that introducing these categories with an earlier mentioned 5-point describes ability to reproduce in much more sophisticated and understandable manner. Dividing articles into 2 groups - these, which are reproducible and these which are not is very misleading. Moreover there are articles, which are difficult to label and it may pose a threat of not labeling them correctly. Thanks to our new system it would be much simpler process for any person who would like to reproduce the article. To support our claim we carried the survey through among students, who also had an opportunity to deal with the reproduction itself. Accroding to them reproducibility topic was missing the decent scale, which could help in determining the level of reproducibility. Most of them made a point that our scale suits their needs perfectly and would rather have it instead of the 2-category one. By and large we are satsified with our small contribution into the world of reproducibility, because it seems it worked out well and made the classification of reproducibility more flexible and appealing to other scientists.
References
Broatch, Jennifer, Jennifer Green, and Andrew Karl. 2018. “RealVAMS: An R Package for Fitting a Multivariate Value- added Model (VAM).” The R Journal 10 (1): 22–30. https://doi.org/10.32614/RJ-2018-033.
Brown, Patrick, and Lutong Zhou. 2010. “MCMC for Generalized Linear Mixed Models with glmmBUGS.” The R Journal 2 (1): 13–17. https://doi.org/10.32614/RJ-2010-003.
Computing Machinery, Association for. 2018. “Artifact Review and Badging.” https://www.acm.org/publications/policies/artifact-review-badging.
Fernández, Daniel Méndez, Daniel Graziotin, Stefan Wagner, and Heidi Seibold. 2019. “Open Science in Software Engineering.” ArXiv abs/1904.06499.
Raff, Edward. 2020. “Quantifying Independently Reproducible Machine Learning.” https://thegradient.pub/independently-reproducible-machine-learning/.
“Reproducibility in Science: A Guide to enhancing reproducibility in scientific results and writing.” 2014. http://ropensci.github.io/reproducibility-guide/.
Vandewalle, Patrick, Jelena Kovacevic, and Martin Vetterli. 2009. “Reproducible Research in Signal Processing.” IEEE Signal Processing Magazine 26 (3): 37–47.
Wilhelm, Stefan, and B. G. Manjunath. 2010. “tmvtnorm: A Package for the Truncated Multivariate Normal Distribution.” The R Journal 2 (1): 25–29. https://doi.org/10.32614/RJ-2010-005.