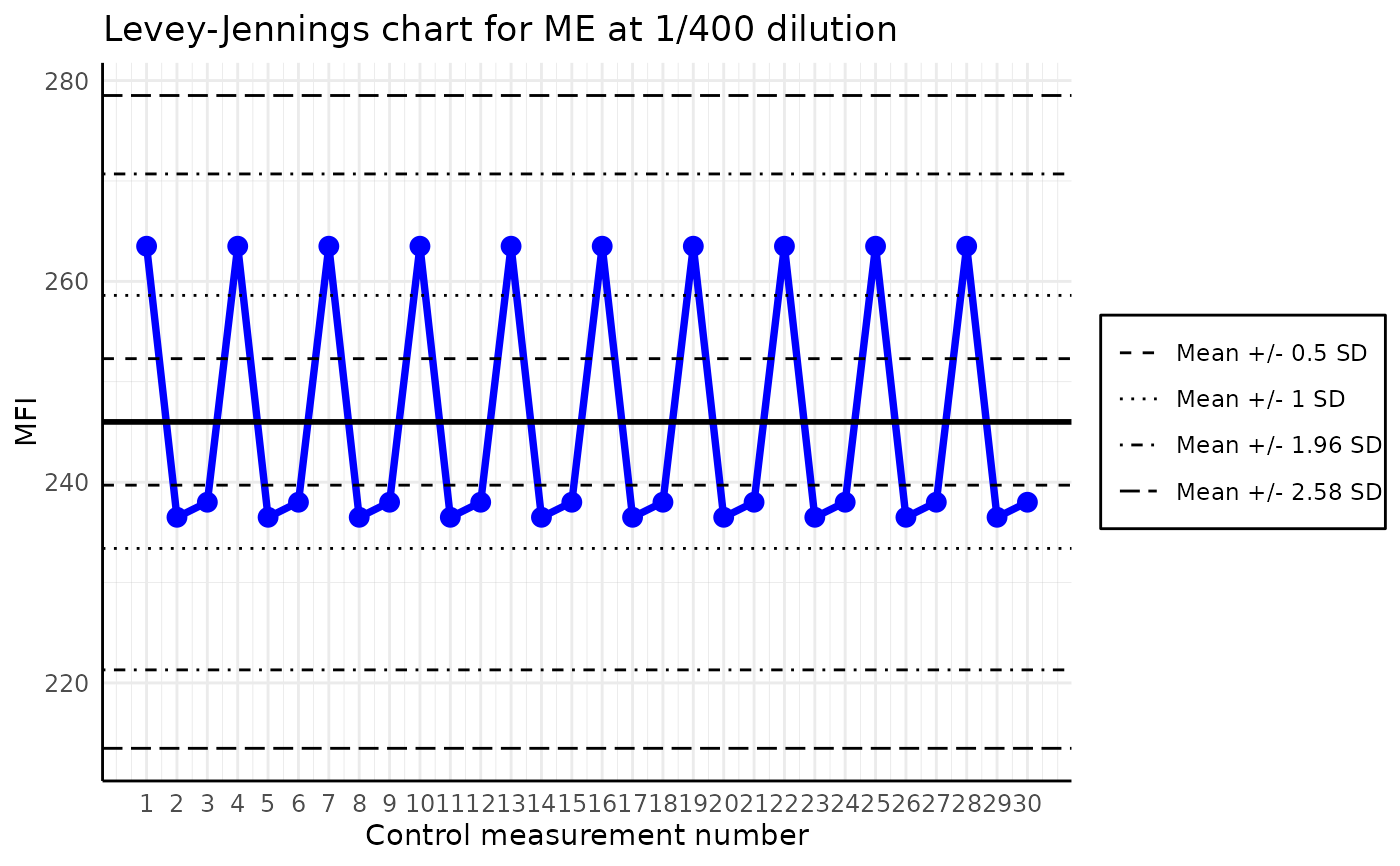
The function plots a Levey-Jennings chart for the given analyte in the list of plates. The Levey-Jennings chart is a graphical representation of the data that enables the detection of outliers and trends. It is a quality control tool that is widely used in the laboratories across the world.
The method takes several parameters that can customise its output.
Except for the required parameters (list_of_plates and analyte_name),
the most significant optional ones are dilution and sd_lines.
The additional parameters can be used for improving the plots interpretability, by customizing the layout, y-scale, etc.
For better readibilty, the plot is zoomed out in the y-axis, by a factor of 1.5.
Usage
plot_levey_jennings(
  list_of_plates,
  analyte_name,
  dilution = "1/400",
  sd_lines = c(1, 2, 3),
  mfi_log_scale = TRUE,
  sort_plates = TRUE,
  plate_labels = "number",
  label_angle = 0,
  legend_position = "bottom",
  data_type = "Median"
)
Arguments
- list_of_plates
A list of plate objects for which to plot the Levey-Jennings chart
- analyte_name
(
character(1)) the analyte for which to plot the Levey-Jennings chart- dilution
(
character(1)) the dilution for which to plot the Levey-Jennings chart. The default is "1/400"- sd_lines
(
numeric) the vector of coefficients for the standard deviation lines to plot, for example, c(1.96, 2.58) will plot four horizontal lines: mean +/- 1.96sd, mean +/- 2.58sd default is c(1, 2, 3) which will plot 6 lines in total- mfi_log_scale
(
logical(1)) specifies if the MFI should be in thelog10scale. By default it equals toTRUE, which corresponds to plotting the chart inlog10scale.- sort_plates
(
logical(1)) ifTRUEsorts plates by the date of examination. IfFALSEplots using the plate order as in input.TRUEby default.- plate_labels
(
character(1)) controls x-axis labels. Can improve readibility of the plot. Takes the following values:"numbers": shows the number of the plate,"names": shows the plate names"dates": shows the date of examination
- label_angle
(
numeric(1)) angle in degrees to rotate x-axis labels. Can improve readibility of the plot. Default: 0- legend_position
the position of the legend, a possible values are
c(right, bottom, left, top, none). Is not used ifplot_legendequals toFALSE.- data_type
(
character(1)) the type of data used plot. The default is "Median"
Examples
# creating temporary directory for the example
output_dir <- tempdir(check = TRUE)

dir_with_luminex_files <- system.file("extdata", "multiplate_reallife_reduced",
  package = "SerolyzeR", mustWork = TRUE
)
list_of_plates <- process_dir(dir_with_luminex_files,
  return_plates = TRUE, format = "xPONENT", output_dir = output_dir
)
#> Reading Luminex data from: /home/runner/work/_temp/Library/SerolyzeR/extdata/multiplate_reallife_reduced/IGG_CO_1_xponent.csv
#> using format xPONENT
#> Failed to extract from BatchMetadata: BatchStartTime not found in BatchMetadata.
#> Failed to extract from raw header: BatchStartTime not found in raw header.
#> Fallback datetime successfully extracted from ProgramMetadata.
#> Could not parse datetime string using default datetime format. Trying other possibilies.
#> Successfully parsed datetime string using order: mdY IM p
#>
#> New plate object has been created with name: IGG_CO_1_xponent!
#>
#> Processing plate 'IGG_CO_1_xponent'
#> Reading Luminex data from: /home/runner/work/_temp/Library/SerolyzeR/extdata/multiplate_reallife_reduced/IGG_CO_2_xponent.csv
#> using format xPONENT
#> Failed to extract from BatchMetadata: BatchStartTime not found in BatchMetadata.
#> BatchStartTime successfully extracted from the header.
#> Could not parse datetime string using default datetime format. Trying other possibilies.
#> Successfully parsed datetime string using order: mdY IMS p
#>
#> New plate object has been created with name: IGG_CO_2_xponent!
#>
#> Processing plate 'IGG_CO_2_xponent'
#> Reading Luminex data from: /home/runner/work/_temp/Library/SerolyzeR/extdata/multiplate_reallife_reduced/IGG_CO_3_xponent.csv
#> using format xPONENT
#> Failed to extract from BatchMetadata: BatchStartTime not found in BatchMetadata.
#> BatchStartTime successfully extracted from the header.
#> Could not parse datetime string using default datetime format. Trying other possibilies.
#> Successfully parsed datetime string using order: mdY IMS p
#>
#> New plate object has been created with name: IGG_CO_3_xponent!
#>
#> Processing plate 'IGG_CO_3_xponent'
#> Extracting the raw MFI to the output dataframe
#> Extracting the raw MFI to the output dataframe
#> Extracting the raw MFI to the output dataframe
#> Merged output saved to: /tmp/RtmpqWeo7P/merged_MFI_20260219_151550.csv
#> Fitting the models and predicting RAU for each analyte
#> Fitting the models and predicting RAU for each analyte
#> Fitting the models and predicting RAU for each analyte
#> Merged output saved to: /tmp/RtmpqWeo7P/merged_RAU_20260219_151550.csv
#> Computing nMFI values for each analyte
#> Computing nMFI values for each analyte
#> Computing nMFI values for each analyte
#> Merged output saved to: /tmp/RtmpqWeo7P/merged_nMFI_20260219_151550.csv
list_of_plates <- rep(list_of_plates, 10) # since we have only 3 plates i will repeat them 10 times

plot_levey_jennings(list_of_plates, "ME", dilution = "1/400", sd_lines = c(0.5, 1, 1.96, 2.58))