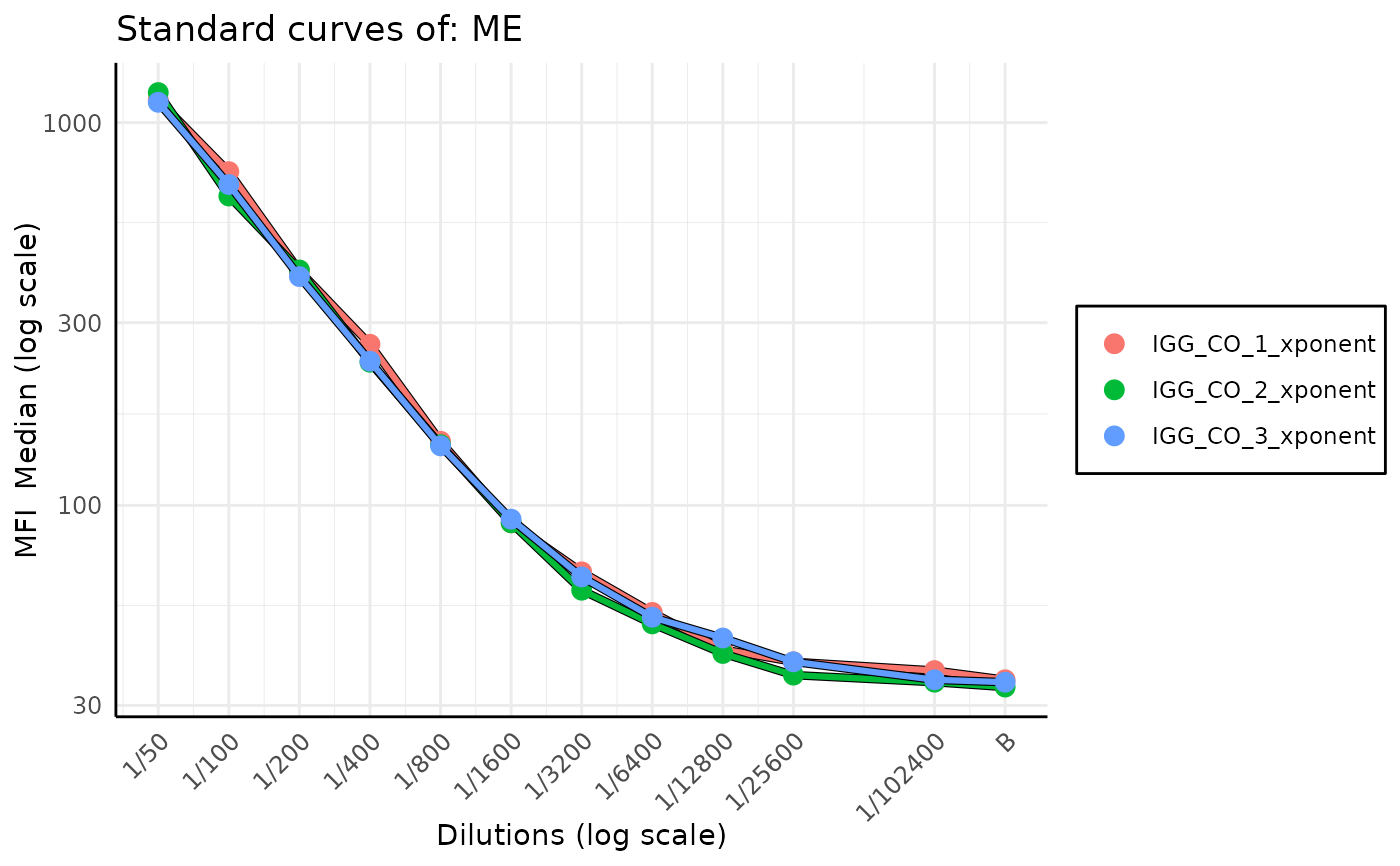
Standard curve stacked plot for levey-jennings report
Source:R/plots-standard_curve.R
plot_standard_curve_stacked.RdFunction generates a plot of stacked on top of each other standard curves for a given analyte form a list of plates. The plot is created with the levey-jennings report in mind, but it can be run by itself.
Usage
plot_standard_curve_stacked(
  list_of_plates,
  analyte_name,
  data_type = "Median",
  decreasing_dilution_order = TRUE,
  monochromatic = TRUE,
  legend_type = NULL,
  log_scale = c("all"),
  verbose = TRUE
)
Arguments
- list_of_plates
list of Plate objects
- analyte_name
Name of the analyte of which standard curves we want to plot.
- data_type
Data type of the value we want to plot - the same datatype as in the plate file. By default equals to
Median- decreasing_dilution_order
If
TRUEthe dilution values are plotted in decreasing order,TRUEby default- monochromatic
If
TRUEthe color of standard curves changes from white (the oldest) to blue (the newest) it helps to observe drift in calibration of the device; otherwise, more varied colours are used,TRUEby default- legend_type
default value is
NULL, then legend type is determined based on monochromatic value. If monochromatic is equal toTRUEthen legend type is set todate, if it isFALSEthen legend type is set toplate_name. User can override this behavior by setting explicitlylegend_typetodateorplate_name.- log_scale
Which elements on the plot should be displayed in log scale. By default
"all". IfNULLorc()no log scale is used, if"all"orc("dilutions", "MFI")all elements are displayed in log scale.- verbose
If
TRUEprints messages,TRUEby default
Examples
# creating temporary directory for the example
output_dir <- tempdir(check = TRUE)

dir_with_luminex_files <- system.file("extdata", "multiplate_reallife_reduced",
  package = "PvSTATEM", mustWork = TRUE
)
list_of_plates <- process_dir(dir_with_luminex_files,
  return_plates = TRUE, format = "xPONENT", output_dir = output_dir
)
#> Reading Luminex data from: /home/runner/work/_temp/Library/PvSTATEM/extdata/multiplate_reallife_reduced/IGG_CO_1_xponent.csv
#> using format xPONENT
#>
#> New plate object has been created with name: IGG_CO_1_xponent!
#>
#> Processing plate 'IGG_CO_1_xponent'
#> Warning: The specified file /tmp/RtmpFPTjFr/IGG_CO_1_xponent_RAU.csv already exists. Overwriting it.
#> Fitting the models and predicting RAU for each analyte
#> Adding the raw MFI values to the output dataframe
#> Saving the computed RAU values to a CSV file located in: '/tmp/RtmpFPTjFr/IGG_CO_1_xponent_RAU.csv'
#> Warning: The specified file /tmp/RtmpFPTjFr/IGG_CO_1_xponent_nMFI.csv already exists. Overwriting it.
#> Computing nMFI values for each analyte
#> Adding the raw MFI values to the output dataframe
#> Saving the computed nMFI values to a CSV file located in: '/tmp/RtmpFPTjFr/IGG_CO_1_xponent_nMFI.csv'
#> Reading Luminex data from: /home/runner/work/_temp/Library/PvSTATEM/extdata/multiplate_reallife_reduced/IGG_CO_2_xponent.csv
#> using format xPONENT
#>
#> New plate object has been created with name: IGG_CO_2_xponent!
#>
#> Processing plate 'IGG_CO_2_xponent'
#> Warning: The specified file /tmp/RtmpFPTjFr/IGG_CO_2_xponent_RAU.csv already exists. Overwriting it.
#> Fitting the models and predicting RAU for each analyte
#> Adding the raw MFI values to the output dataframe
#> Saving the computed RAU values to a CSV file located in: '/tmp/RtmpFPTjFr/IGG_CO_2_xponent_RAU.csv'
#> Warning: The specified file /tmp/RtmpFPTjFr/IGG_CO_2_xponent_nMFI.csv already exists. Overwriting it.
#> Computing nMFI values for each analyte
#> Adding the raw MFI values to the output dataframe
#> Saving the computed nMFI values to a CSV file located in: '/tmp/RtmpFPTjFr/IGG_CO_2_xponent_nMFI.csv'
#> Reading Luminex data from: /home/runner/work/_temp/Library/PvSTATEM/extdata/multiplate_reallife_reduced/IGG_CO_3_xponent.csv
#> using format xPONENT
#>
#> New plate object has been created with name: IGG_CO_3_xponent!
#>
#> Processing plate 'IGG_CO_3_xponent'
#> Warning: The specified file /tmp/RtmpFPTjFr/IGG_CO_3_xponent_RAU.csv already exists. Overwriting it.
#> Fitting the models and predicting RAU for each analyte
#> Adding the raw MFI values to the output dataframe
#> Saving the computed RAU values to a CSV file located in: '/tmp/RtmpFPTjFr/IGG_CO_3_xponent_RAU.csv'
#> Warning: The specified file /tmp/RtmpFPTjFr/IGG_CO_3_xponent_nMFI.csv already exists. Overwriting it.
#> Computing nMFI values for each analyte
#> Adding the raw MFI values to the output dataframe
#> Saving the computed nMFI values to a CSV file located in: '/tmp/RtmpFPTjFr/IGG_CO_3_xponent_nMFI.csv'
plot_standard_curve_stacked(list_of_plates, "ME", data_type = "Median", monochromatic = FALSE)
