Plot standard curve of a certain analyte with fitted model
Source:R/plots-standard_curve.R
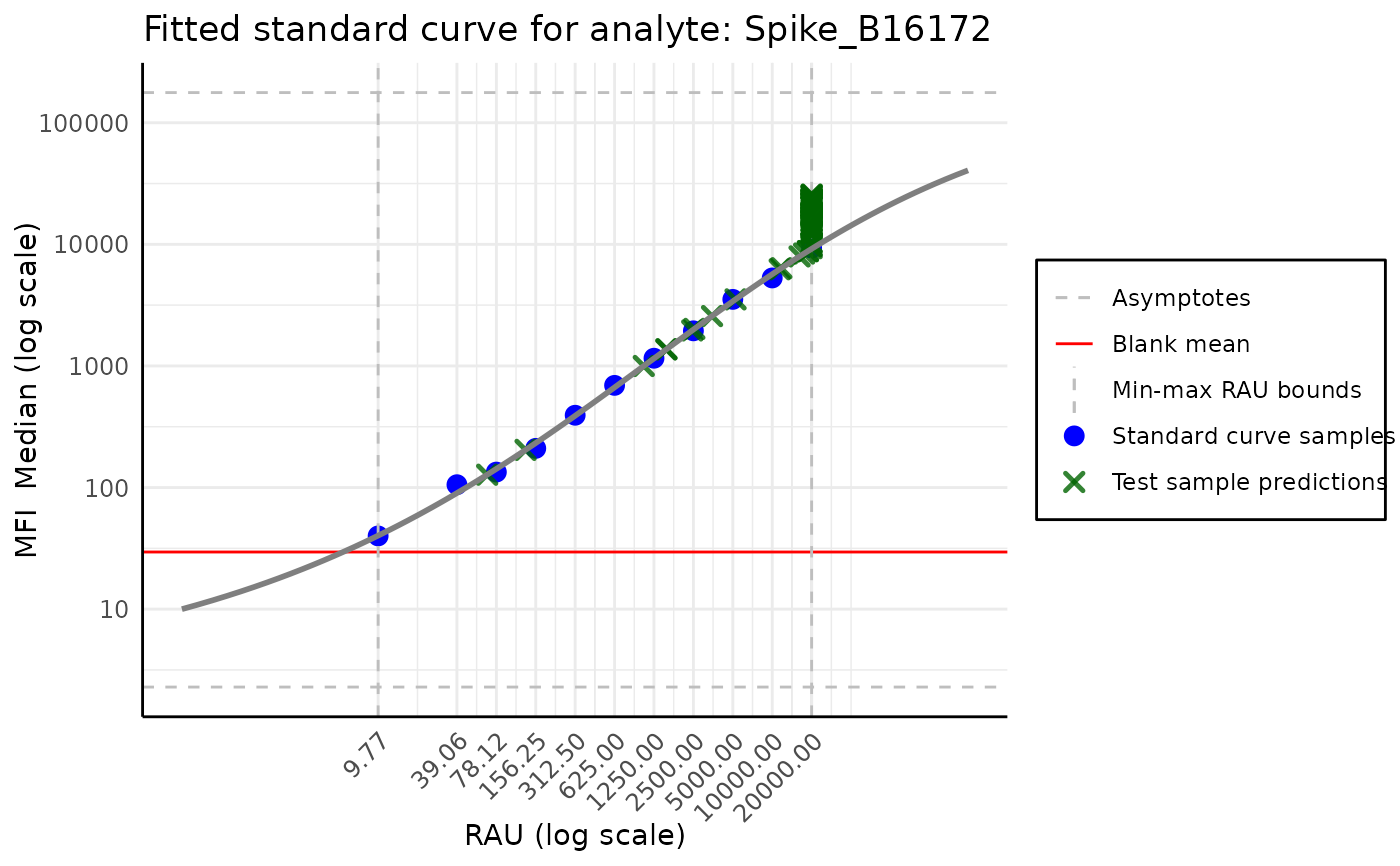
plot_standard_curve_analyte_with_model.RdFunction plots the values of standard curve samples and the fitted model.
Usage
plot_standard_curve_analyte_with_model(
  plate,
  model,
  data_type = "Median",
  decreasing_rau_order = TRUE,
  log_scale = c("all"),
  plot_asymptote = TRUE,
  plot_test_predictions = TRUE,
  plot_blank_mean = TRUE,
  plot_rau_bounds = TRUE,
  plot_legend = TRUE,
  verbose = TRUE,
  ...
)
Arguments
- plate
Plate object
- model
fitted
Modelobject, which predictions we want to plot- data_type
Data type of the value we want to plot - the same datatype as in the plate file. By default equals to
Median- decreasing_rau_order
If
TRUEthe RAU values are plotted in decreasing order,TRUEby default.- log_scale
Which elements on the plot should be displayed in log scale. By default
"all". IfNULLorc()no log scale is used, if"all"orc("RAU", "MFI")all elements are displayed in log scale.- plot_asymptote
If
TRUEthe asymptotes are plotted,TRUEby default- plot_test_predictions
If
TRUEthe predictions for the test samples are plotted,TRUEby default. The predictions are obtained through extrapolation of the model- plot_blank_mean
If
TRUEthe mean of the blank samples is plotted,TRUEby default- plot_rau_bounds
If
TRUEthe RAU bounds are plotted,TRUEby default- plot_legend
If
TRUEthe legend is plotted,TRUEby default- verbose
If
TRUEprints messages,TRUEby default- ...
Additional arguments passed to the
predictfunction
Examples
path <- system.file("extdata", "CovidOISExPONTENT.csv",
  package = "PvSTATEM", mustWork = TRUE
)
layout_path <- system.file("extdata", "CovidOISExPONTENT_layout.xlsx",
  package = "PvSTATEM", mustWork = TRUE
)
plate <- read_luminex_data(path, layout_filepath = layout_path, verbose = FALSE)
model <- create_standard_curve_model_analyte(plate, analyte_name = "Spike_B16172")
plot_standard_curve_analyte_with_model(plate, model, decreasing_rau_order = FALSE)
#> Scale for colour is already present.
#> Adding another scale for colour, which will replace the existing scale.