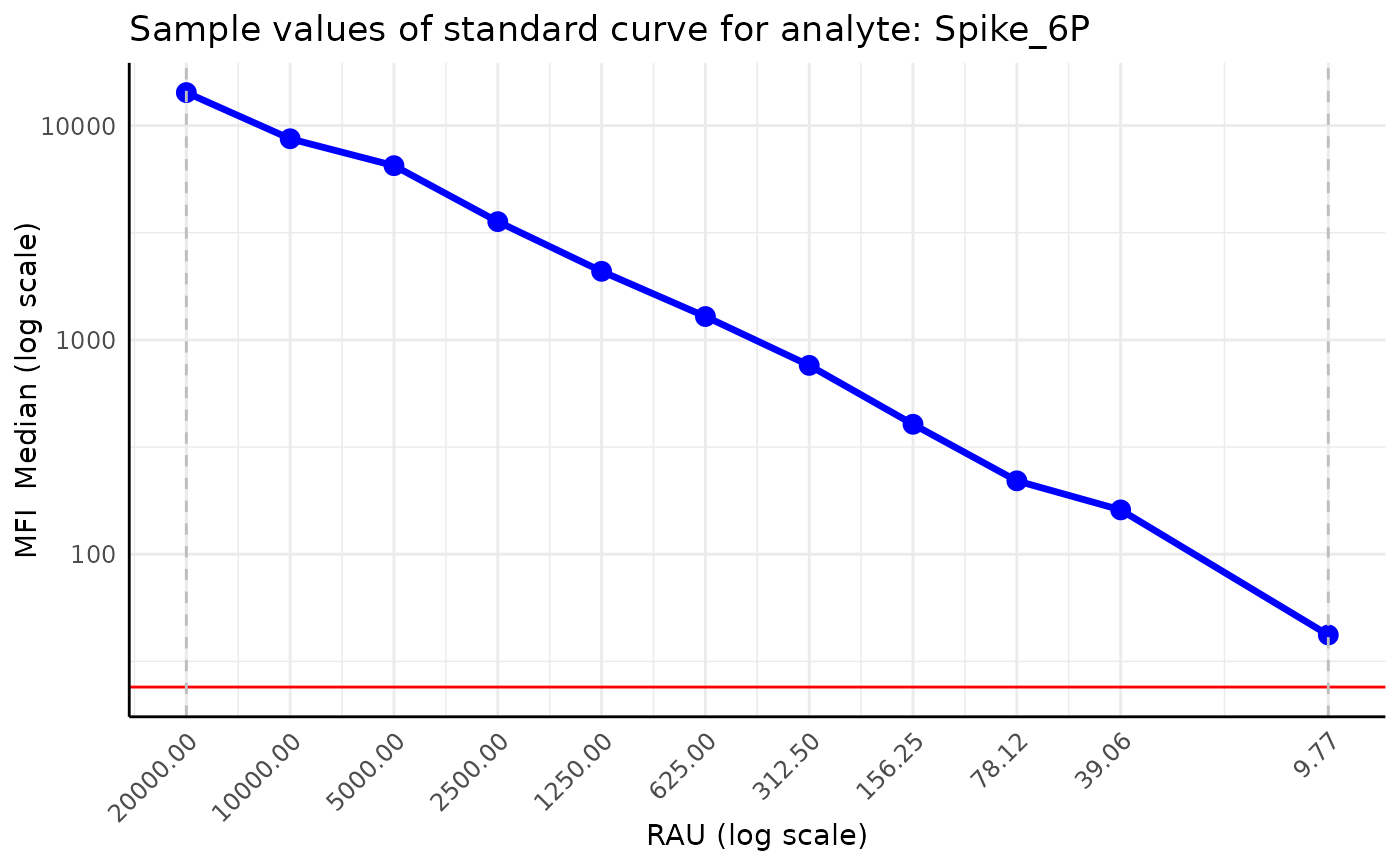
Plot standard curve samples of a plate of a given analyte.
Usage
plot_standard_curve_analyte(
  plate,
  analyte_name,
  data_type = "Median",
  decreasing_rau_order = TRUE,
  log_scale = c("all"),
  plot_line = TRUE,
  plot_blank_mean = TRUE,
  plot_rau_bounds = TRUE,
  plot_legend = TRUE,
  verbose = TRUE
)
Arguments
- plate
A plate object
- analyte_name
Name of the analyte of which standard curve we want to plot.
- data_type
Data type of the value we want to plot - the same datatype as in the plate file. By default equals to
Net MFI- decreasing_rau_order
If
TRUEthe RAU values are plotted in decreasing order,TRUEby default- log_scale
Which elements on the plot should be displayed in log scale. By default
"RAU". IfNULLorc()no log scale is used, if"all"orc("RAU", "MFI")all elements are displayed in log scale.- plot_line
If
TRUEa line is plotted,TRUEby default- plot_blank_mean
If
TRUEthe mean of the blank samples is plotted,TRUEby default- plot_rau_bounds
If
TRUEthe RAU values bounds are plotted,TRUEby default- plot_legend
If
TRUEthe legend is plotted,TRUEby default- verbose
If
TRUEprints messages,TRUEby default
Examples
path <- system.file("extdata", "CovidOISExPONTENT.csv",
  package = "PvSTATEM", mustWork = TRUE
)
layout_path <- system.file("extdata", "CovidOISExPONTENT_layout.xlsx",
  package = "PvSTATEM", mustWork = TRUE
)
plate <- read_luminex_data(path, layout_filepath = layout_path, verbose = FALSE)
plot_standard_curve_analyte(plate, "Spike_6P", plot_legend = FALSE, data_type = "Median")