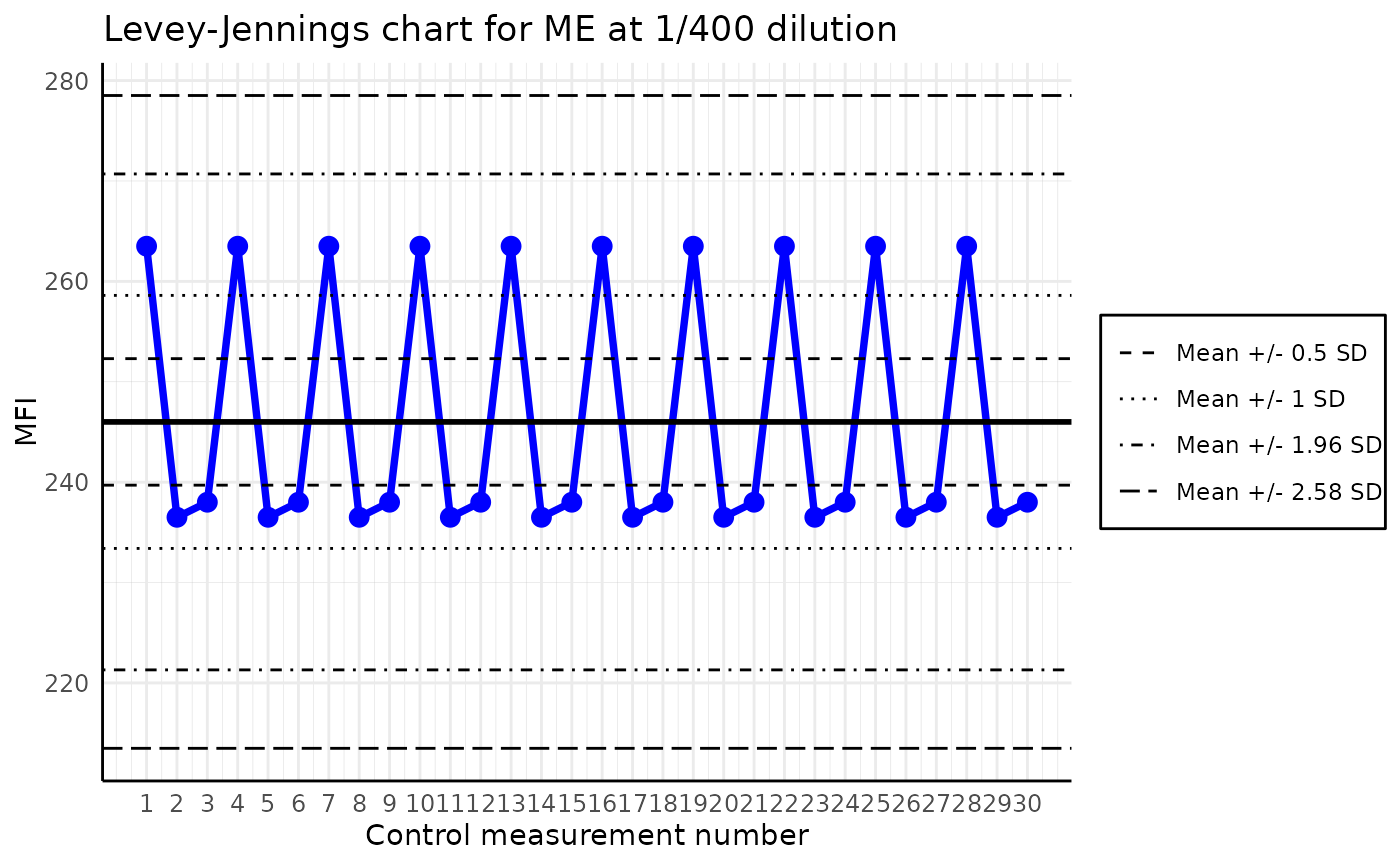
The function plots a Levey-Jennings chart for the given analyte in the list of plates. The Levey-Jennings chart is a graphical representation of the data that enables the detection of outliers and trends. It is a quality control tool that is widely used in the laboratories across the world.
Usage
plot_levey_jennings(
  list_of_plates,
  analyte_name,
  dilution = "1/400",
  sd_lines = c(1.96),
  data_type = "Median"
)
Arguments
- list_of_plates
A list of plate objects for which to plot the Levey-Jennings chart
- analyte_name
(
character(1)) the analyte for which to plot the Levey-Jennings chart- dilution
(
character(1)) the dilution for which to plot the Levey-Jennings chart. The default is "1/400"- sd_lines
(
numeric) the vector of coefficients for the standard deviation lines to plot, for example, c(1.96, 2.58) will plot four horizontal lines: mean +/- 1.96sd, mean +/- 2.58sd default is c(1.96) which will plot two lines mean +/- 1.96*sd- data_type
(
character(1)) the type of data used plot. The default is "Median"
Examples
# creating temporary directory for the example
output_dir <- tempdir(check = TRUE)

dir_with_luminex_files <- system.file("extdata", "multiplate_reallife_reduced",
  package = "PvSTATEM", mustWork = TRUE
)
list_of_plates <- process_dir(dir_with_luminex_files,
  return_plates = TRUE, format = "xPONENT", output_dir = output_dir
)
#> Reading Luminex data from: /home/runner/work/_temp/Library/PvSTATEM/extdata/multiplate_reallife_reduced/IGG_CO_1_xponent.csv
#> using format xPONENT
#>
#> New plate object has been created with name: IGG_CO_1_xponent!
#>
#> Processing plate 'IGG_CO_1_xponent'
#> Warning: The specified file /tmp/RtmpFPTjFr/IGG_CO_1_xponent_RAU.csv already exists. Overwriting it.
#> Fitting the models and predicting RAU for each analyte
#> Adding the raw MFI values to the output dataframe
#> Saving the computed RAU values to a CSV file located in: '/tmp/RtmpFPTjFr/IGG_CO_1_xponent_RAU.csv'
#> Warning: The specified file /tmp/RtmpFPTjFr/IGG_CO_1_xponent_nMFI.csv already exists. Overwriting it.
#> Computing nMFI values for each analyte
#> Adding the raw MFI values to the output dataframe
#> Saving the computed nMFI values to a CSV file located in: '/tmp/RtmpFPTjFr/IGG_CO_1_xponent_nMFI.csv'
#> Reading Luminex data from: /home/runner/work/_temp/Library/PvSTATEM/extdata/multiplate_reallife_reduced/IGG_CO_2_xponent.csv
#> using format xPONENT
#>
#> New plate object has been created with name: IGG_CO_2_xponent!
#>
#> Processing plate 'IGG_CO_2_xponent'
#> Warning: The specified file /tmp/RtmpFPTjFr/IGG_CO_2_xponent_RAU.csv already exists. Overwriting it.
#> Fitting the models and predicting RAU for each analyte
#> Adding the raw MFI values to the output dataframe
#> Saving the computed RAU values to a CSV file located in: '/tmp/RtmpFPTjFr/IGG_CO_2_xponent_RAU.csv'
#> Warning: The specified file /tmp/RtmpFPTjFr/IGG_CO_2_xponent_nMFI.csv already exists. Overwriting it.
#> Computing nMFI values for each analyte
#> Adding the raw MFI values to the output dataframe
#> Saving the computed nMFI values to a CSV file located in: '/tmp/RtmpFPTjFr/IGG_CO_2_xponent_nMFI.csv'
#> Reading Luminex data from: /home/runner/work/_temp/Library/PvSTATEM/extdata/multiplate_reallife_reduced/IGG_CO_3_xponent.csv
#> using format xPONENT
#>
#> New plate object has been created with name: IGG_CO_3_xponent!
#>
#> Processing plate 'IGG_CO_3_xponent'
#> Warning: The specified file /tmp/RtmpFPTjFr/IGG_CO_3_xponent_RAU.csv already exists. Overwriting it.
#> Fitting the models and predicting RAU for each analyte
#> Adding the raw MFI values to the output dataframe
#> Saving the computed RAU values to a CSV file located in: '/tmp/RtmpFPTjFr/IGG_CO_3_xponent_RAU.csv'
#> Warning: The specified file /tmp/RtmpFPTjFr/IGG_CO_3_xponent_nMFI.csv already exists. Overwriting it.
#> Computing nMFI values for each analyte
#> Adding the raw MFI values to the output dataframe
#> Saving the computed nMFI values to a CSV file located in: '/tmp/RtmpFPTjFr/IGG_CO_3_xponent_nMFI.csv'
list_of_plates <- rep(list_of_plates, 10) # since we have only 3 plates i will repeat them 10 times

plot_levey_jennings(list_of_plates, "ME", dilution = "1/400", sd_lines = c(0.5, 1, 1.96, 2.58))
