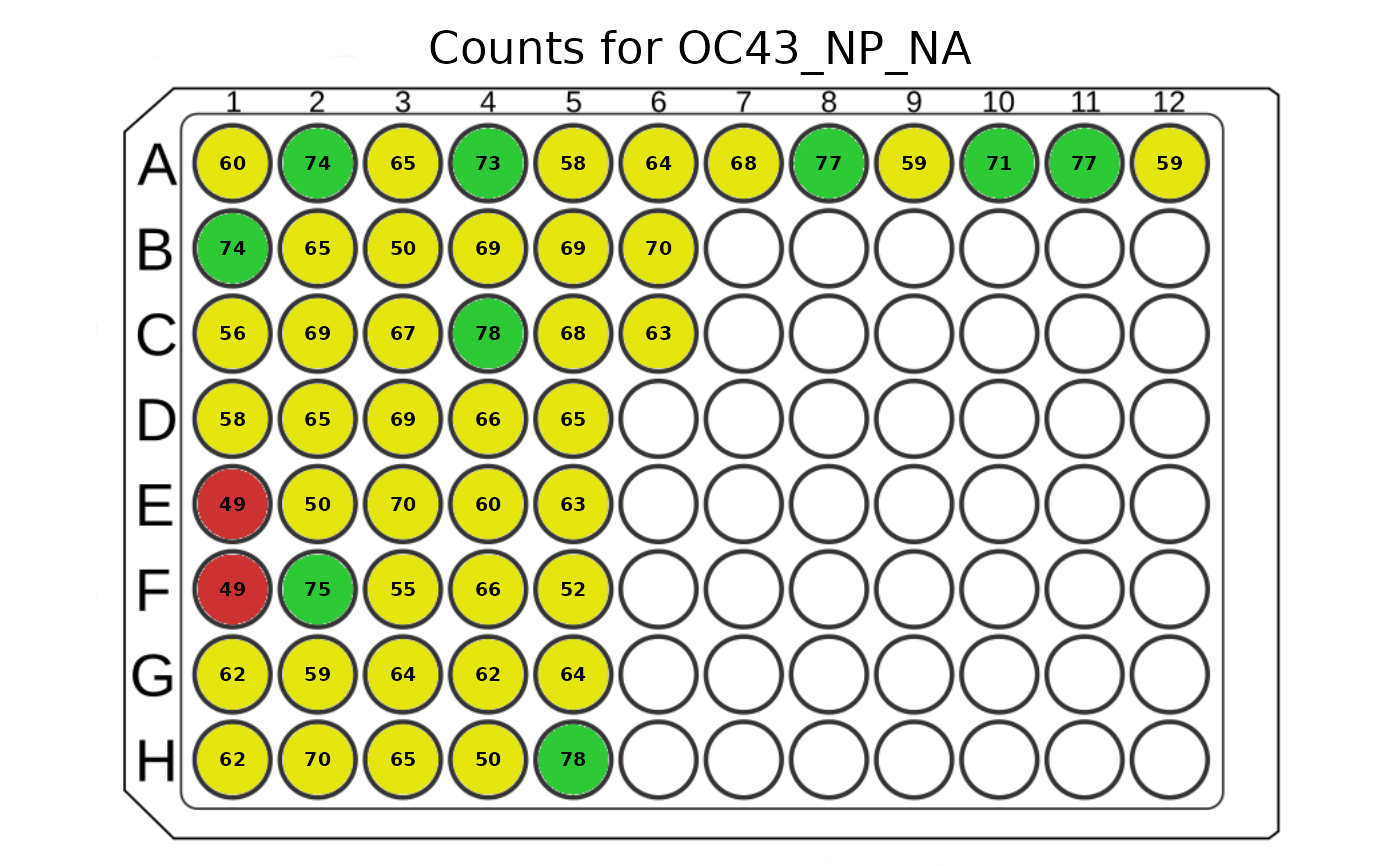
This function plots counts in a 96-well plate using a colour to represent the count ranges.
There is a possibility of plotting exact counts in each well.
If the plot window is resized, it's best to re-run the function to adjust the scaling.
Sometimes, when a legend is plotted, the whole layout may be shifted. It's best to stretch the window, and everything will be adjusted automatically.
Usage
plot_counts(
  plate,
  analyte_name,
  plot_counts = TRUE,
  plot_legend = FALSE,
  lower_threshold = 50,
  higher_threshold = 70
)
Arguments
- plate
The plate object with the counts data
- analyte_name
The name of the analyte
- plot_counts
Logical indicating if the counts should be plotted
- plot_legend
Logical indicating if the legend should be plotted
- lower_threshold
The lower threshold for the counts, it separates green and yellow colours
- higher_threshold
The higher threshold for the counts, it separates yellow and red colours
Examples
plate_filepath <- system.file("extdata", "CovidOISExPONTENT_CO.csv",
  package = "PvSTATEM", mustWork = TRUE
)
layout_filepath <- system.file("extdata", "CovidOISExPONTENT_CO_layout.xlsx",
  package = "PvSTATEM", mustWork = TRUE
)
plate <- read_luminex_data(plate_filepath, layout_filepath)
#> Reading Luminex data from: /home/runner/work/_temp/Library/PvSTATEM/extdata/CovidOISExPONTENT_CO.csv
#> using format xPONENT
#>
#> New plate object has been created with name: CovidOISExPONTENT_CO!
#>
plot_counts(
  plate = plate, analyte_name = "OC43_NP_NA",
  plot_counts = TRUE, plot_legend = FALSE
)