Introduction
In this blog, we summarize the work of our colleagues from the same faculty: Correlation between reproducibility of research papers and their objective. They used more than 30 papers coming from The R Journal in order to do research on the reproducibility of scientific papers.
But what is reproducibility?

The easiest way to describe reproducibility is ‘the part’ of the given article that we can obtain by ourselves using the attached code in its chunks. By ‘the part’ can be meant the real fraction of the article (the same plots and tables) or simply the existence of sources and creating approximated results - just to show the tendency of some variables in a data set. That is why high reproducibility leads to high credibility of each scientific paper, and vice versa.
How was reproducibility measured?
To create a better comparison, authors measured reproducibility using 1-5 scale. The ‘5’ score meant that the article could not be re-created at all and the ‘1’ score was attached only to completely reproducible scientific papers. The range of reproducibility across the given article also varied in order to get a better insight. Our colleagues considered reproducibility measurements in 3 levels:
- the goal of the article (e.g. package review)
- the collective purpose of a group of chunks (e.g. generating a table)
- each chunk’s individual objective (e.g. loading data, transforming data)
There were considered 6, 9 and 17 different goals respectively for each level of reproducibility measurement.
Why using the correlation?
If the reproducibility measures are dependent (or correlated), considering both of them is unnecessary beacause of their redundance. The example of such situation is creating a table and a plot with the same data but in different chunks. If the used data set was already unavailable, both chunks would lose their credibility. In order to make the research more concise, the repetitions have to be avoided. Such dependent variables cannot be often found without difficulties and that is why the correlation matrix is used: to confirm there were no correlated variables.
Results
Reproducibility table for each chunk

Each row here represents a chunk. The table denotes the length of each chunk, its reproducibility scale and one-hot encoded purposes. For example: the first chunk (of length 5) is reproducible with a slight error, while functioning as a “functional example”, but not necessarily as a “foreign error” or “data preparation”.
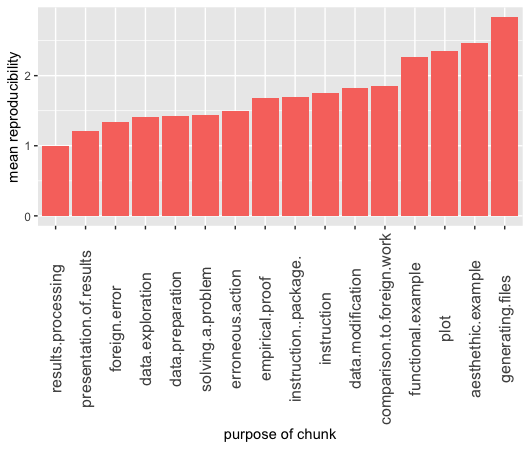
Mean reproducibility depending on individual objectives

Chunks focused on results processing maintain full reproducibility, with the mean of 1. Other highly reproductive chunks are the ones dedicated to presentation of results or foreign error, while the lowest reproducibility is noticed in chunks for generating files.
Other than that, there has been no relation between reproducibility and purpose detected, which may be nonetheless depending on a dataset.
Correlation matrices
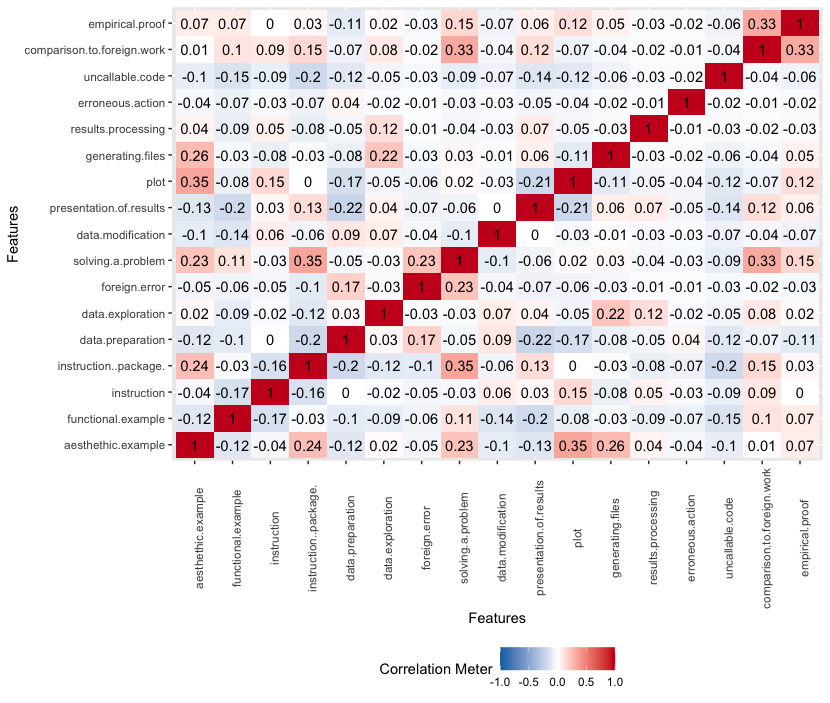
Purposes

The first matrix presents little correlation between any two chunks’ individual purposes, which suggests the chunks being correctly chosen. Four pairs were completely uncorrelated (with a correlation 0); on the other hand, there was an understandable correlation of 0.35 for the pair plot - aesthetic.example.
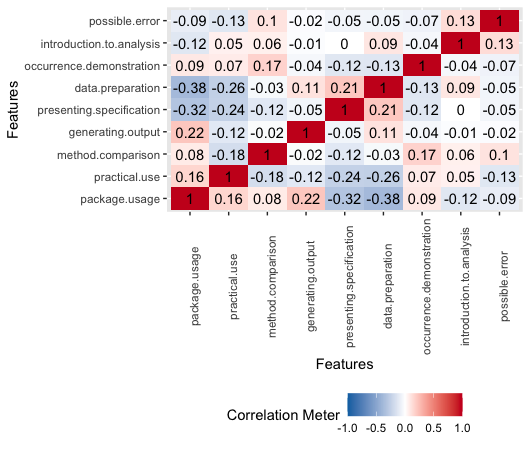
Groups

Chunks’ groups have no significant correlations either.
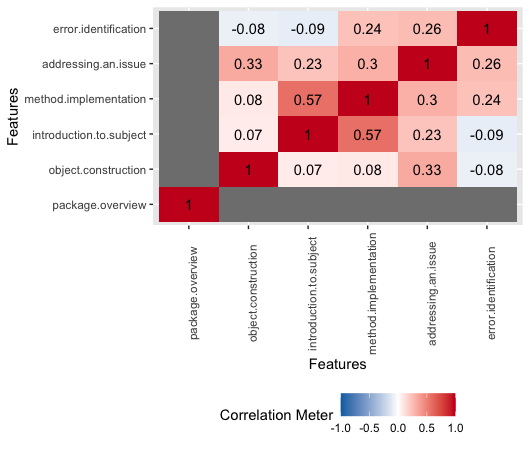
Articles

There can be seen a noticeable correlation between chunks in articles focusing on introduction to a subject and method implementation. The correlation is undefined for package overview.
Opinions
Overall, the research was performed precisely: charts are simply made and easly readable, while all of the methods used were carefully explained pointing to details. The only flaw that we could notice is, that an article about reproducibility actually lacks some reproducibility capabilities. Precisely speaking, there are some shortages about ‘csv’ files used for generating results. As readers, we can get a basic idea of how they were made, but to reproduce the results we would need these information provided in more specified way.
Then again, it is only a tiny detail to correct in the future, which does not change the fact that the article remains a solid research.