TL;DR
Lot of people would like to find the best method to impute data, that covers most of the cases, but from this article we will learn that the task of imputing missing data is not so trivial. It demands looking at a bigger picture, for example model type or percentage of missing data. Reading this article we will learn what algorithms to use in which cases and understand the vast problem of imputation.
Introduction
We have read an article about imputation techniques and their interaction with ML algorithms. It was written by Martyna Majchrzak, Agata Makarewicz, Jacek Wiśniewski. Before reading we were expecting to find out which imputation techniques are the best and how to use them. This article has shown us that the case is not as simple as we have thought and there is no definite answer to this question. Despite that we have acquired valuable knowledge, that can be utilised in data preparation and choosing the best algorithm for datasets with high percentage of missing values.
Comparison
Authors have selected 14 datasets to work with, each one is divided into a training (80%) and testing (20%) and after that all of 5 imputation methods are used on them to find out which one is the best. Those methods consists of:
- mean/mode imputation - putting mean in continuous variables and mode in discrete variables,
- mice (predictive mean matching) - it creates multiple replacement values for multivariate missing data,
- k-nearest neighbours - aggregation of the non-missing values of the k nearest neighbours,
- hotdeck - missing values are replaced with an observed response from a “similar” unit,
- softImpute combined with median/mode imputation - for numeric variables function softImpute(), for remaining variables, missing values are imputed with median or mode.
Performance (F1 score is our metric) was calculated on 5 ML algorithms, which are:
- RPART (Recursive Partitioning And Regression Trees),
- NB (Naive Bayes),
- Ranger (Random forest),
- LDA (Linear Discriminant Analysis),
- KNN (k-Nearest Neighbour).
Later in the process a rank system is used. This system gives 1 to the best imputation and 5 to the worst one on all datasets and then returns mean rank for each algorithm. Also if imputation is incomplete it scores 5. This idea has it’s strong sites, because F1 score can vary depending on the structure of the dataset, which is bad when we want to compare them. However we think that a better idea would be to scale the result to 0-1, because in the rank system we lose the information about dispersion of results in the same dataset.
Results
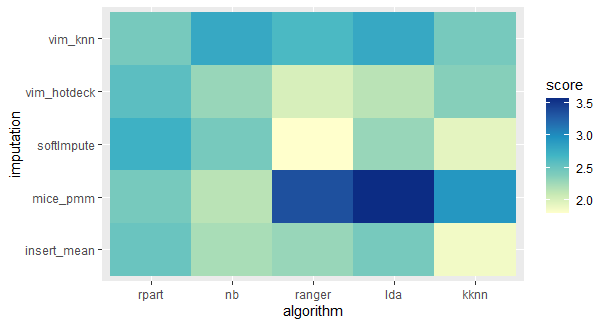
This heatmap shows how algorithms work with all data.
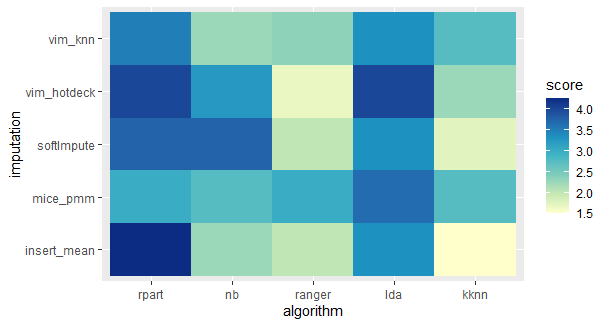
Here we can see that there is a difference, because it worked only on data with high percentage of missing data.
From those two heatmaps we can see that there is no “the best” approach. From this article we have learned which imputation methods work good with a high percentage of missing data. We can also observe that some ML algorithms work better with specific imputation approaches, so it is important to remember when choosing how to impute missing data, when we want to use a specific algorithm.
This article shows that there is a prefered imputation for each algorithm. The pairs are shown below:
- Rpart - VIM knn,
- Naive Bayes - MICE pmm,
- Ranger - VIM hotdeck and softImpute,
- LDA - VIM hotdeck,
- KKNN - mean/mode imputation.